
No Guesswork, Just Growth
Marketing is math with a message. You can’t improve what you don’t measure—and in 2025, campaign analytics tools are your compass to profitable growth. Whether you’re a solo founder or a full-service agency, knowing your numbers isn’t optional—it’s the difference between scaling and stalling.
Below, I’ve curated the top tools for analyzing marketing campaign performance—organized by what they actually help you measure. Let’s turn data into decisions.
🎯 1. Campaign Overview Tools

Google Analytics 4 (GA4)
Still the backbone of performance tracking. GA4 helps you monitor traffic, engagement, conversions, and user paths across your website and ads.
Why it’s great:
✅ Free forever
✅ Deep audience insights
✅ Integrates with Google Ads and Search Console
Pro tip: Set up conversion tracking early. Without it, even the best ad metrics mean nothing.
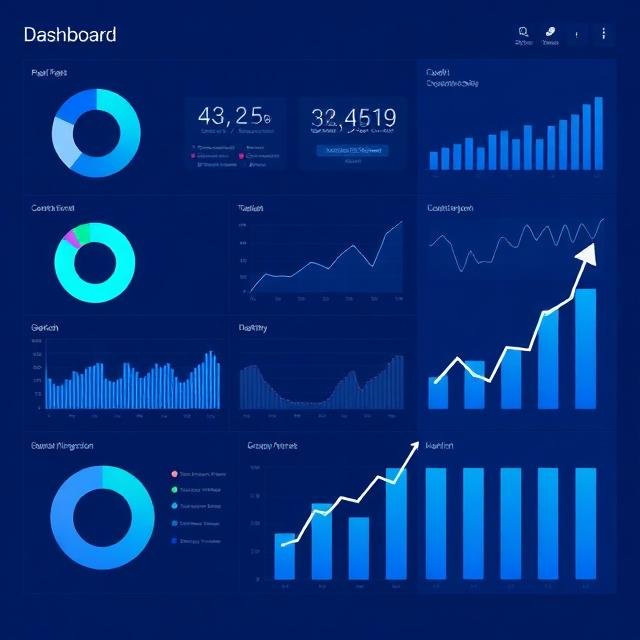
Looker Studio
If GA4 is the data engine, Looker Studio is the dashboard that turns raw data into client-ready visuals.
Why marketers love it:
📊 Customizable dashboards
📈 Real-time updates
🤝 Pulls data from over 200 sources (Meta, TikTok, HubSpot, etc.)
📥 2. Traffic & Source Analysis
UTM.io
A must-have for clean campaign tracking. It organizes and shortens all your UTM links—so you know exactly which ad, post, or email brought each visitor.
Bonus:
It prevents messy data that breaks attribution in Google Analytics.
SimilarWeb
Gives you competitive benchmarks. See which channels your competitors rely on (search, social, referrals) and adjust your own mix accordingly.
💰 3. Conversion & ROI Tracking

HubSpot Marketing Hub (Free & Paid)
Tracks contacts, clicks, and customer journeys automatically. You can see which emails, ads, and blogs drive the most closed deals.
Why marketers love it:
💰 Clear ROI tracking
🔁 Lead nurturing built-in
📞 Syncs with your CRM for sales reporting
Triple Whale (for eCommerce)
If you’re selling products online, Triple Whale connects your ad spend, pixel data, and Shopify sales—all in one dashboard.
Visuals at a glance: CPA, ROAS, AOV, LTV—every number that matters.
🖱️ 4. Heatmaps & User Behavior
Hotjar
Watch where users scroll, stop, and click. Identify drop-off points before they hurt conversions.
Pro tip: If 80% of users never scroll to your CTA, it’s not your product—it’s your layout.
Microsoft Clarity
A free alternative to Hotjar. Offers unlimited heatmaps and session recordings without hurting site speed.
📊 5. Reporting & Dashboards
Databox
Connects to almost any marketing platform and builds performance dashboards that update automatically. Perfect for agencies or small teams managing multiple clients.
Supermetrics
Pulls metrics from dozens of marketing tools into Google Sheets or Looker Studio. Ideal for marketers who prefer raw data they can shape themselves.
📣 6. Social & Ad Performance

Meta Ads Manager
Tracks impressions, reach, clicks, and conversions in real time. Use breakdowns by age, location, and device to pinpoint your best audiences.
TikTok Analytics
Shows watch time, engagement rate, and conversions—great for spotting trends before they fade.
Pro tip: Combine TikTok and GA4 data for a full view of how short-form videos affect your website traffic.
🤖 7. Automation & Alerts

Zapier
Set up automations like:
- “New lead in HubSpot → Slack alert → add to Google Sheet.”
Frees up hours weekly while keeping your team aligned.
Metricool
Tracks and schedules your social posts, but also gives clear analytics—CTR, best post times, and follower growth rate across all platforms.
🧠 Bonus: How to Read the Numbers That Matter
AI Image Prompt:
“Analytics dashboard with key marketing KPIs highlighted in green: CPA, ROAS, CTR, AOV, conversion rate.”
Here’s what to track weekly (and why):
📈 CPA (Cost Per Acquisition) – How much you pay for a single customer.
💰 ROAS (Return on Ad Spend) – How efficiently your ads make money.
🧲 CTR (Click-Through Rate) – Measures the strength of your creative.
🛒 AOV (Average Order Value) – Boost this, and profit multiplies.
🎯 Conversion Rate – The ultimate success metric.
60-Second Action Checklist
🕒 Open GA4 and check top-performing channels.
📊 Link Google Ads + Search Console for cross-data tracking.
📈 Build one Looker Studio dashboard with your top KPIs.
⚡ Set one Zap to get alerts when conversions spike or drop.
📅 Review every Friday, and double down on what beats last week’s ROI.
Final Thought
Marketing analytics isn’t about data overload—it’s about clarity. Use fewer tools, but use them deeply. Once you can see exactly where each dollar goes, scaling becomes a formula, not a gamble.
And discover how marketing strategy and storytelling can drive real results for your business!
When you’re exploring the perfect colors for alabaster skin or endeavoring to discover your seasonal color palette, aids like color analysis apps and quizzes can be surprisingly helpful. For instance, doing an undertone vein test can explain whether you have blue veins undertone or yellow undertone skin, which is crucial when opting between deep summer color palette or light spring color palette. You can also review free online color analysis services to get a immediate idea of what colors appear flattering on pale skin or yellow skin tone.
Seasonal color analysis separates skin tones into types like deep summer, soft summer, or dark winter color palette, helping you find your most suitable shades. For those with distinctive skin tones such as amber skin tone, olive skin tone, or red undertone skin, knowing your skin shade chart and seasonal color palette truly makes a effect in clothing decisions. If you want to dive deeper into color analysis pro or use different hair color simulators together with your skin tone color, visit color analysis online to get going.